---
title: The Reporting Paradox
description: Learn how to enhance security reporting by focusing on risk reduction, recovery readiness, and enterprise value protection for effective leadership decision-making.
image: https://www.humanrisks.com/hubfs/The%20reporting%20paradox.jpg
---
[Skip to content](https://www.humanrisks.com/insights/the-reporting-paradox#main-content)
Close
- [Platform](https://www.humanrisks.com/platform)
- [Risk Assessment](https://www.humanrisks.com/platform/risk-assessments)
- [Incident Reports](https://www.humanrisks.com/platform/incident-reports)
- [Questionnaires](https://www.humanrisks.com/platform/questionnaires)
- [Tasks](https://www.humanrisks.com/platform/tasks)
- [Business Continuity Management](https://www.humanrisks.com/platform/bcm)
- [Business Impact Analysis](https://www.humanrisks.com/platform/bcm/business-impact-analysis)
- [Business Continuity Plans](https://www.humanrisks.com/platform/bcm)
- [Crisis Management](https://www.humanrisks.com/platform/bcm/crisis-management)
- [Mass Communication](https://www.humanrisks.com/platform/mass-comms)
- [Industries](https://www.humanrisks.com/industries)
- [Manufacturing](https://www.humanrisks.com/industry/manufacturing)
- [Banking & Financial Services](https://www.humanrisks.com/industry/banking-and-financial-services)
- [Critical Infrastructure](https://www.humanrisks.com/industry/critical-infrastructure)
- [Pharmaceuticals](https://www.humanrisks.com/industry/pharmaceuticals)
- [Professional Services](https://www.humanrisks.com/industry/professional-services)
- [Resources](https://www.humanrisks.com/resources)
- [Security Templates](https://www.humanrisks.com/resources/templates)
- [Risk Assessment](https://www.humanrisks.com/resources/risk-assessment-series)
- [Webinars](https://www.humanrisks.com/resources/webinars)
- [Whitepapers](https://www.humanrisks.com/resources/whitepapers)
- [Insights](https://www.humanrisks.com/insights)
- [Customer Cases](https://www.humanrisks.com/customer-cases)
SEARCH
CONTACT
E-MAIL: [info@humanrisks.com](mailto:info@humanrisks.com)
[Book a Demo](https://www.humanrisks.com/book-a-demo)
[](https://www.humanrisks.com/)
- [Platform](https://www.humanrisks.com/platform)
- [Industries](https://www.humanrisks.com/industries)
- [Resources](https://www.humanrisks.com/resources)
E-MAIL: [info@humanrisks.com](mailto:info@humanrisks.com)
[Book a Demo](https://www.humanrisks.com/book-a-demo)
Quick results for "{search\_term}"
[Risk Assessments](https://www.humanrisks.com/platform/risk-assessments)[Incident Reports](https://www.humanrisks.com/platform/incident-reports)[Questionnaires](https://www.humanrisks.com/platform/questionnaires)[Tasks](https://www.humanrisks.com/platform/tasks)[Business Continuity Management](https://www.humanrisks.com/platform/bcm)
[Business Impact Analysis](https://www.humanrisks.com/platform/bcm/business-impact-analysis)[Business Continuity Plans](https://www.humanrisks.com/platform/bcm/business-continuity-plans)[Crisis Management](https://www.humanrisks.com/platform/bcm/crisis-management)[Mass Communications](https://www.humanrisks.com/platform/mass-comms)
[Manufacturing](https://www.humanrisks.com/industry/manufacturing)[Banking & Financial Services](https://www.humanrisks.com/industry/banking-and-financial-services)[Critical Infrastructure](https://www.humanrisks.com/industry/critical-infrastructure)
[Pharmaceuticals](https://www.humanrisks.com/industry/pharmaceuticals)[Professional Services](https://www.humanrisks.com/industry/professional-services)
[Security Templates](https://www.humanrisks.com/resources/templates)[Risk Assessment](https://www.humanrisks.com/resources/risk-assessment-series)[Webinars](https://www.humanrisks.com/resources/webinars)
[Whitepapers](https://www.humanrisks.com/resources/whitepapers)[Insights](https://www.humanrisks.com/insights)[Customer Cases](https://www.humanrisks.com/customer-cases)

[Human Risks](https://www.humanrisks.com/insights/author/human-risks)5 min read
# The Reporting Paradox
The best outcomes in security reporting are measured in incidents contained, disruptions absorbed, and losses avoided. But the main challenge of security and resilience reporting is really proving the value of something that hasn’t happened yet. The solution is not creating impact data where none exists. The solution is [building reporting](https://www.humanrisks.com/platform) around the values important to leadership: risk reduction, recovery readiness, regulatory standing, enterprise value protection.
The way to start the reporting is by providing leadership with a one-page summary, answering these four questions: are we resilient enough, where are the gaps, are we improving, and what does it protect?
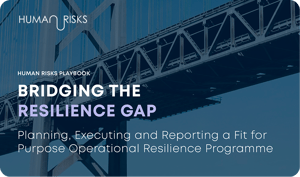
Our playbook ***Bridging the Resilience Gap*** covers how to structure your reporting, including a practical metrics framework designed around the questions leadership needs to answer.
[Download the playbook](https://www.humanrisks.com/bridging-the-gap-operational-resilience)
### Report around the Risk, not the Programme
Most security and resilience reporting is built backwards. Teams report what they can count: assessments completed, plans updated, exercises conducted. These reports are visible and easily quantified, but they miss the point. They answer the question "what did we do?", while the leadership needs to know "are we protected?".
The result is operational updates that inform without enabling decisions, metrics that track activity rather than outcomes, and board papers describing the programme rather than the risk posture. A resilience programme that cannot translate its work into strategic terms will often be funded as a cost centre, regardless of the value it delivers.
The fix is not more data. It is a different design decision: structure reporting around the risk, not the programme.
### The KPI and KRI Distinction
The most common reporting failure is building metrics forward from whatever data is easy to count: assessments completed, plans updated, exercises run. These are Key Performance Indicators (KPIs): they look backward at what the programme has delivered. What they miss is the forward view. Key Risk Indicators (KRIs) look ahead to the threat landscape the programme must address.
Together, KPIs and KRIs provide leadership with what they need: confirmation the programme is executing, and early warning where it may not be keeping pace with the risk environment. A reporting framework built only on performance indicators creates a false sense of security. The programme appears to be working, but it cannot show whether it is working fast enough or in the right places. Therefore, the use of KPIs and KRIs is ideal.
### Four Leadership Questions
If the leadership team asks "are we resilient enough?" and the answer requires a 30 pages slide deck with operational briefing, the programme likely has a reporting problem - not a data problem. An effective security and resilience reporting framework is designed to enable a one-page leadership summary answering four questions:
- Are we resilient enough? Can the organisation absorb and recover from plausible disruption scenarios within acceptable tolerances?
- Where are the gaps? What are the most significant single points of failure, residual risks, and untested recovery capabilities?
- Are we improving? Is the programme maturing and the risk posture strengthening over time?
- What is the delivered value? What is the investment case for resilience, expressed in terms of enterprise value protection?
### Aligning Reporting with Business Planning Cycles
Even well-designed reporting fails if it arrives at the wrong moment. Security and resilience reporting that operates on its own cadence, in its own language, through its own channels will remain in a silo. Here is what reporting alignment means in practice:
Cadence
Resilience reporting should map onto the cycles the business already uses: quarterly business reviews (QBRs), annual planning processes, board reporting calendars. The goal is to ensure that when resilience is reported, it arrives at the right decision point, not six weeks after the capital allocation discussion has concluded.
Language
Security and resilience data must be expressed in the actual language of the business. Translating operational language into strategic language is not a presentation exercise. It is a design decision that should be made when the metrics are defined, not when the slide deck is assembled.
Integration
Resilience dashboards should feed directly into enterprise risk registers, strategic planning inputs, and capital allocation decisions. A standalone resilience report that is disconnected from the enterprise view, duplicates effort and complicates decision making.
### A Practical Metrics Framework
[***Bridging the Resilience Gap Playbook***](https://www.humanrisks.com/bridging-the-gap-operational-resilience) includes an illustrative metrics framework organised across four dimensions, each paired with the leadership question it answers.
- Programme Performance ("Are we executing?")
Assessment coverage across critical assets, percentage of recovery plans reviewed and validated within the last 12 months, exercise completion against the annual programme, and audit posture across internal and external findings.
- Risk Posture ("Are we exposed?")
Aggregated critical asset risk ratings, single points of failure identified and remediated, and critical supplier dependency scores.
- Response Readiness ("Can we recover?")
Percentage of exercise outcomes within defined recovery time and recovery point objectives, average incident response activation times, and percentage of critical services tested against plausible scenarios.
- Value Protection ("What does it protect?")
Incidents contained within impact tolerances, estimated value of operational downtime avoided, and programme maturity trajectory.
The depth and breadth of metrics must be proportionate to the programme's maturity and the organisation's complexity. The standard deliberately leaves the specifics to the security and resilience team, because metrics without operating context produce data without insight.
| ### Illustritave Metrics Framework | | | |
| --- | --- | --- | --- |
| ##### Pregramme Performance *Are we executing?* | ##### Risk Posture *Are we exposed?* | ##### Response Readiness *Can we recover?* | ##### Value Protection *What does it protect?* |
| - Assessment coverage across critical assets \[KPI\] - % of recovery plans reviewed and validated within the last 12 months \[KPI\] - Exercise completion against annual programme \[KPI\] - Audit posture: internal and external findings (open, closed & overdue) \[KPI\] | - Aggregated critical risk ratings \[KRI\] - Single points of failure: identified and remediated \[KRI\] - Critical supplier dependency scores \[KRI\] | - % exercise outsomes within defined RTOs and RPOs \[KRI\] - Average incident response activation times \[KPI/KRI\] - % critical services tested against plausible scenarios \[KPI\] | - Incidents contained within impact tolerances \[KPI/KRI\] - Est. value of operational downtime avoided \[KPI\] - Programme maturity score \[KPI\] |
### What This Means in Practice
Effective security and resilience are measured in incidents contained and disruptions absorbed. The non-event is the best outcome, and non-events are difficult to quantify. But leadership already recognises the categories of value that resilience protects: revenue, regulatory standing, operational continuity, and reputation.
Reporting that connects programme activity to those categories shifts the conversation. From "here is what we did" to "here is what we protected, where the exposure remains, and what it would take to close the gap."
That is the difference between a programme funded as an administrative obligation and one positioned as a strategic capability.
*This is the first part of our blog series drawn from our playbook, Bridging the Resilience Gap: Planning, Executing and Reporting a Fit for Purpose Operational Resilience Programme.*
[Download the playbook now](https://www.humanrisks.com/bridging-the-gap-operational-resilience)

[Human Risks](https://www.humanrisks.com/insights/author/human-risks)Human Risks is a security risk management (SRM) and business continuity management (BCM) platform, combining both disciplines in a single standardised environment covering the full risk landscape, including physical security. Refined through partnerships with Fortune 500 organisations and over 2,500 professionals worldwide, including teams at HSBC, GSK, and Yondr, the platform consolidates risk assessments, impact analysis, continuity planning, crisis management, and incident reporting. Intelligent automation delivers risk assessments in under 15 minutes, with 90% less manual work. Human Risks is trusted across industries like logistics, pharmaceuticals, banking, and critical infrastructure, driving a business-centred approach to security that supports resilience and informed decision-making.
[mailto:info@humanrisks.com](mailto:info@humanrisks.com)
## RELATED ARTICLES
### [Douglas Gray5 min read Prioritizing the Human Element | When Technology Alone is not Enough When a new problem emerges, business leaders often turn to technology for a solution. Software platforms offer scalable, and ... Start Reading](https://www.humanrisks.com/insights/blog/people-process-technology)
### [Human Risks2 min read The Security Professional's Guide to ESG: Predicting the Future Recently, there has been a fair amount of buzz about the role that ESG plays in business. Undoubtedly, ESG is only rising in ... Start Reading](https://www.humanrisks.com/insights/blog/keep-an-eye-out-for-esg-security-professionals-guide-to-predicting-the-future)
### [Human Risks6 min read If Everyone’s Responsible for Security… Then No One Is? It sounds great, democratic, empowering, and even inspiring. It suggests that every person in the organization, regardless of ... Start Reading](https://www.humanrisks.com/insights/blog/if-everyones-responsible-for-security-then-no-one-is)
[](https://www.humanrisks.com/)
Human Risks builds EU-hosted **[security risk management](https://www.humanrisks.com/platform)**and **[business continuity software](https://www.humanrisks.com/platform/bcm)** for organisations where physical assets matter. We are ISO 27001 and ISO 9001 certified by the British Assessment Bureau. We serve customers across multiple industries and at more than 7,500 sites worldwide.
- [Platform](https://www.humanrisks.com/platform)
- [Risk Assessments](https://www.humanrisks.com/platform/risk-assessments)
- [Tasks](https://www.humanrisks.com/platform/tasks)
- [Incident Reports](https://www.humanrisks.com/platform/incident-reports)
- [Questionnaires](https://www.humanrisks.com/platform/questionnaires)
- [Business Continuity](https://www.humanrisks.com/platform/bcm)
- [Business Impact Analysis](https://www.humanrisks.com/platform/bcm/business-impact-analysis)
- [Business Continuity Plans](https://www.humanrisks.com/platform/bcm/business-continuity-plans)
- [Crisis Management](https://www.humanrisks.com/platform/bcm/crisis-management)
- [Mass Communications](https://www.humanrisks.com/platform/mass-comms)
- [Resources](https://www.humanrisks.com/resources)
- [CER Directive Practical Guide](https://www.humanrisks.com/cer-guide)
- [Whitepapers](https://www.humanrisks.com/resources/whitepapers)
- [Webinars](https://www.humanrisks.com/resources/webinars)
- [Security Templates](https://www.humanrisks.com/resources/templates)
- [Risk Assessment](https://www.humanrisks.com/resources/risk-assessment-series)
- [Case Studies](https://www.humanrisks.com/customer-cases)
- [Insights](https://www.humanrisks.com/insights)
- [Podcast](https://tr.ee/KvAUisFgFY)
- Company
- [About Us](https://www.humanrisks.com/company/about-us)
- [Partners](https://www.humanrisks.com/company/partners)
- [Careers](https://www.humanrisks.com/company/careers)
- [Contact](https://www.humanrisks.com/company/contact)
© All rights reserved, Human Risks 2026
- [Privacy Policy](https://www.humanrisks.com/privacy-policy)
- [Legal Disclaimer](https://www.humanrisks.com/hubfs/Website%20Assets/Company/Legal%20Disclaimer.pdf)
- [Data Security](https://www.humanrisks.com/hubfs/Website%20Assets/Company/Security-White-Paper_V1.9_2024.04.29_HumanRisks1.pdf)
```json
{
"@context" : "https://schema.org",
"@type" : "Organization",
"address" : {
"@type" : "PostalAddress",
"addressCountry" : "Denmark",
"addressLocality" : "Aalborg",
"addressRegion" : "Nordjylland",
"postalCode" : "9000",
"streetAddress" : "Adelgade 12"
},
"email" : "info@humanrisks.com",
"knowsLanguage" : "en",
"logo" : {
"@type" : "ImageObject",
"url" : "https://26655958.fs1.hubspotusercontent-eu1.net/hubfs/26655958/Human%20Risks_Logo-4.png"
},
"name" : "Human Risks",
"url" : "https://www.humanrisks.com/insights/the-reporting-paradox"
}
```
```json
{
"@context" : "https://schema.org",
"@type" : "BlogPosting",
"abstract" : "Learn how to enhance security reporting by focusing on risk reduction, recovery readiness, and enterprise value protection for effective leadership decision-making.",
"author" : {
"@type" : "Person",
"name" : "Human Risks"
},
"dateModified" : "",
"datePublished" : "",
"headline" : "The Reporting Paradox",
"image" : "https://26655958.fs1.hubspotusercontent-eu1.net/hubfs/26655958/The%20reporting%20paradox.jpg",
"inLanguage" : "en",
"keywords" : "[Risk Assessment Methodology]",
"mainEntityOfPage" : {
"@type" : "WebPage"
},
"name" : "The Reporting Paradox",
"publisher" : {
"@type" : "Organization",
"logo" : {
"@type" : "ImageObject",
"url" : ""
},
"name" : "Human Risks"
},
"text" : "The best outcomes in security reporting are measured in incidents contained, disruptions absorbed, and losses avoided. But the main challenge of security and resilience reporting is really proving the value of something that hasn’t happened yet. The solution is not creating impact data where none exists. The solution is building reporting around the values important to leadership: risk reduction, recovery readiness, regulatory standing, enterprise value protection. The way to start the reporting is by providing leadership with a one-page summary, answering these four questions: are we resilient enough, where are the gaps, are we improving, and what does it protect? Our playbook Bridging the Resilience Gap covers how to structure your reporting, including a practical metrics framework designed around the questions leadership needs to answer. Download the playbook Report around the Risk, not the Programme Most security and resilience reporting is built backwards. Teams report what they can count: assessments completed, plans updated, exercises conducted. These reports are visible and easily quantified, but they miss the point. They answer the question \"what did we do?\", while the leadership needs to know \"are we protected?\". The result is operational updates that inform without enabling decisions, metrics that track activity rather than outcomes, and board papers describing the programme rather than the risk posture. A resilience programme that cannot translate its work into strategic terms will often be funded as a cost centre, regardless of the value it delivers. The fix is not more data. It is a different design decision: structure reporting around the risk, not the programme. The KPI and KRI Distinction The most common reporting failure is building metrics forward from whatever data is easy to count: assessments completed, plans updated, exercises run. These are Key Performance Indicators (KPIs): they look backward at what the programme has delivered. What they miss is the forward view. Key Risk Indicators (KRIs) look ahead to the threat landscape the programme must address. Together, KPIs and KRIs provide leadership with what they need: confirmation the programme is executing, and early warning where it may not be keeping pace with the risk environment. A reporting framework built only on performance indicators creates a false sense of security. The programme appears to be working, but it cannot show whether it is working fast enough or in the right places. Therefore, the use of KPIs and KRIs is ideal. Four Leadership Questions If the leadership team asks \"are we resilient enough?\" and the answer requires a 30 pages slide deck with operational briefing, the programme likely has a reporting problem - not a data problem. An effective security and resilience reporting framework is designed to enable a one-page leadership summary answering four questions: Are we resilient enough? Can the organisation absorb and recover from plausible disruption scenarios within acceptable tolerances? Where are the gaps? What are the most significant single points of failure, residual risks, and untested recovery capabilities? Are we improving? Is the programme maturing and the risk posture strengthening over time? What is the delivered value? What is the investment case for resilience, expressed in terms of enterprise value protection? Aligning Reporting with Business Planning Cycles Even well-designed reporting fails if it arrives at the wrong moment. Security and resilience reporting that operates on its own cadence, in its own language, through its own channels will remain in a silo. Here is what reporting alignment means in practice: Cadence Resilience reporting should map onto the cycles the business already uses: quarterly business reviews (QBRs), annual planning processes, board reporting calendars. The goal is to ensure that when resilience is reported, it arrives at the right decision point, not six weeks after the capital allocation discussion has concluded. Language Security and resilience data must be expressed in the actual language of the business. Translating operational language into strategic language is not a presentation exercise. It is a design decision that should be made when the metrics are defined, not when the slide deck is assembled. Integration Resilience dashboards should feed directly into enterprise risk registers, strategic planning inputs, and capital allocation decisions. A standalone resilience report that is disconnected from the enterprise view, duplicates effort and complicates decision making. A Practical Metrics Framework Bridging the Resilience Gap Playbook includes an illustrative metrics framework organised across four dimensions, each paired with the leadership question it answers. Programme Performance (\"Are we executing?\") Assessment coverage across critical assets, percentage of recovery plans reviewed and validated within the last 12 months, exercise completion against the annual programme, and audit posture across internal and external findings. Risk Posture (\"Are we exposed?\") Aggregated critical asset risk ratings, single points of failure identified and remediated, and critical supplier dependency scores. Response Readiness (\"Can we recover?\") Percentage of exercise outcomes within defined recovery time and recovery point objectives, average incident response activation times, and percentage of critical services tested against plausible scenarios. Value Protection (\"What does it protect?\") Incidents contained within impact tolerances, estimated value of operational downtime avoided, and programme maturity trajectory. The depth and breadth of metrics must be proportionate to the programme's maturity and the organisation's complexity. The standard deliberately leaves the specifics to the security and resilience team, because metrics without operating context produce data without insight. Illustritave Metrics Framework Pregramme Performance Are we executing? Risk Posture Are we exposed? Response Readiness Can we recover? Value Protection What does it protect? Assessment coverage across critical assets [KPI] % of recovery plans reviewed and validated within the last 12 months [KPI] Exercise completion against annual programme [KPI] Audit posture: internal and external findings (open, closed & overdue) [KPI] Aggregated critical risk ratings [KRI] Single points of failure: identified and remediated [KRI] Critical supplier dependency scores [KRI] % exercise outsomes within defined RTOs and RPOs [KRI] Average incident response activation times [KPI/KRI] % critical services tested against plausible scenarios [KPI] Incidents contained within impact tolerances [KPI/KRI] Est. value of operational downtime avoided [KPI] Programme maturity score [KPI] What This Means in Practice Effective security and resilience are measured in incidents contained and disruptions absorbed. The non-event is the best outcome, and non-events are difficult to quantify. But leadership already recognises the categories of value that resilience protects: revenue, regulatory standing, operational continuity, and reputation. Reporting that connects programme activity to those categories shifts the conversation. From \"here is what we did\" to \"here is what we protected, where the exposure remains, and what it would take to close the gap.\" That is the difference between a programme funded as an administrative obligation and one positioned as a strategic capability. This is the first part of our blog series drawn from our playbook, Bridging the Resilience Gap: Planning, Executing and Reporting a Fit for Purpose Operational Resilience Programme. Download the playbook now",
"url" : "https://www.humanrisks.com/insights/the-reporting-paradox",
"wordCount" : "2763"
}
```
```json
{
"@context" : "https://schema.org",
"@type" : "BlogPosting",
"author" : {
"@type" : "Person",
"name" : "Human Risks",
"url" : "https://www.humanrisks.com/insights/author/human-risks"
},
"dateModified" : "2026-09-14T07:29:42.052Z",
"datePublished" : "2026-07-22T07:32:39.000Z",
"headline" : "The Reporting Paradox",
"image" : [ "https://www.humanrisks.com/hubfs/The%20reporting%20paradox.jpg" ],
"mainEntityOfPage" : {
"@id" : "https://www.humanrisks.com/insights/the-reporting-paradox",
"@type" : "WebPage"
},
"publisher" : {
"@type" : "Organization",
"logo" : {
"@type" : "ImageObject",
"url" : "https://www.humanrisks.com/hubfs/Human%20Risks_Logo-4.png"
},
"name" : "Human Risks"
}
}
```
```json
{
"@context" : "https://schema.org",
"@type" : "BreadcrumbList",
"itemListElement" : [ {
"@type" : "ListItem",
"item" : "https://www.humanrisks.com",
"name" : "Home",
"position" : 1
}, {
"@type" : "ListItem",
"item" : "https://www.humanrisks.com/insights",
"name" : "Insights",
"position" : 2
}, {
"@type" : "ListItem",
"item" : "https://www.humanrisks.com/insights/the-reporting-paradox",
"name" : "The Reporting Paradox",
"position" : 3
} ]
}
```
```json
{
"@context" : "https://schema.org",
"@type" : "BlogPosting",
"articleSection" : "Risk Assessment Methodology",
"author" : {
"@type" : "Organization",
"name" : "Human Risks",
"url" : "https://www.humanrisks.com/insights/author/human-risks"
},
"dateModified" : "2026-07-21",
"datePublished" : "2026-07-21",
"description" : "Learn how to enhance security reporting by focusing on risk reduction, recovery readiness, and enterprise value protection for effective leadership decision-making.",
"headline" : "The Reporting Paradox",
"image" : "https://26655958.fs1.hubspotusercontent-eu1.net/hubfs/26655958/Human%20Risks%20Blog/The%20reporting%20paradox.jpg",
"mainEntityOfPage" : {
"@id" : "https://www.humanrisks.com/insights/the-reporting-paradox",
"@type" : "WebPage"
},
"publisher" : {
"@type" : "Organization",
"logo" : {
"@type" : "ImageObject",
"url" : "https://www.humanrisks.com/hs-fs/hubfs/Website%20Assets/Company/Logo%20Round%20Blue.jpg"
},
"name" : "Human Risks"
}
}
```